SECTION 1: THE MARINE FOOD CHAIN
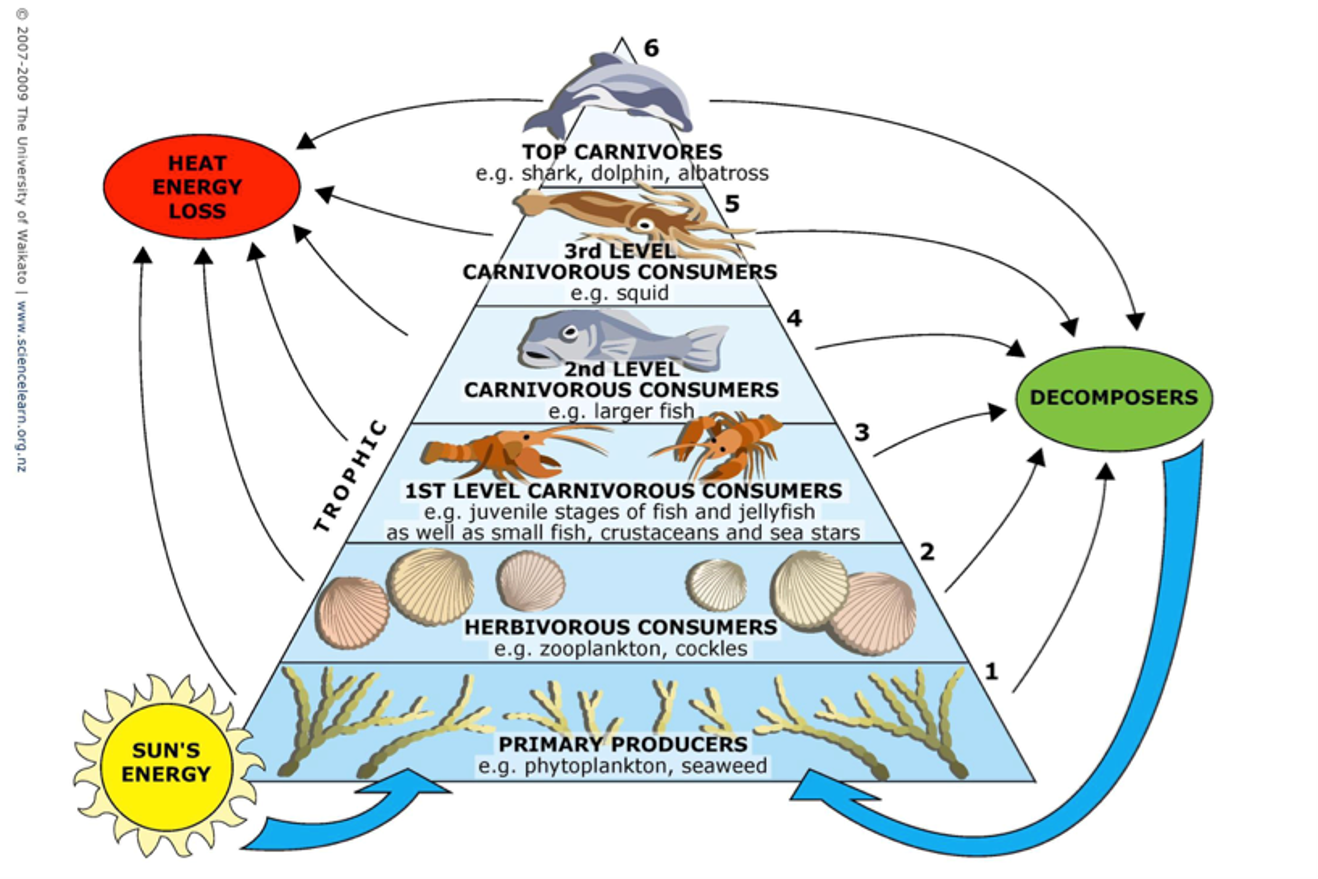
Everything in the ocean eats something else. That chain of who-eats-whom is called a food chain, and the position an organism occupies in it is called its trophic level (from the Greek trophē, meaning food or nourishment). The simulator you will use tracks six levels — starting with the water itself and ending at the top of the chain, where humans often sit.
Trophic level matters for one important reason: every time something gets eaten, the chemicals stored in its tissues are passed on — and concentrated further — in the predator's body. The higher up the chain, the more accumulated chemistry you're inheriting from every meal below you.
The six levels of the food chain in the simulator are shuffled below. Click each organism in the correct order — start with what's at the very bottom of the chain and work your way up to the apex. Click a placed tile to remove it and return it to the pool.
WHAT DOES "TROPHIC LEVEL" ACTUALLY MEAN?
Trophic Level 1 (TL1) = producers — organisms that make their own food from sunlight. Trophic Level 2 (TL2) = primary consumers — organisms that eat the producers. Each subsequent level eats the level below it. Humans and other apex predators sit at TL5 — we're eating chemistry that has been passed through and concentrated at every step below us.
SECTION 2: PERSISTENT ORGANIC POLLUTANTS
The contaminants modeled in the simulator belong to a category called POPs — Persistent Organic Pollutants. The name gives away what makes them dangerous: they are persistent (they don't break down in the environment), organic (carbon-based chemistry, originally synthesized by humans), and pollutants (they cause biological harm).
The key property that makes POPs so problematic in food chains is that they are lipophilic — fat-loving. They dissolve easily in fat and oily tissues, but not in water. When an organism ingests a POP, the chemical leaves the digestive system and moves into fat cells, where it stays. It is not excreted the way water-soluble substances are. This is why contamination accumulates over an animal's lifetime and why it concentrates further every time an animal eats another contaminated animal.
THE TWO KEY PROPERTIES OF ALL POPS
Lipophilic: dissolves in fat, not water — so it accumulates in fatty tissues and is not excreted normally.
Persistent: the chemical bond structure resists breakdown by UV light, water, and biological enzymes — so it stays in the environment and in bodies, sometimes for decades.

Click any card to flip it and reveal the definition
SECTION 3: BIOACCUMULATION vs. BIOMAGNIFICATION
These two terms are often confused — and sometimes used interchangeably, incorrectly. They describe related but distinct processes. Understanding the difference is essential for interpreting what the simulator shows you.
BIOACCUMULATION
Happens within a single organism over its lifetime. The organism takes in a contaminant faster than it can get rid of it, so the chemical builds up in its tissues. A dolphin that eats contaminated fish every day for 30 years will accumulate far more PCBs than a dolphin that lives for one year, even if they eat the same diet. Time matters.
BIOMAGNIFICATION
Happens across trophic levels. A predator eats thousands of contaminated prey over its lifetime and retains nearly all of the chemical load from all of them in its own, much smaller body mass. The concentration multiplies at each step up the chain — not by adding, but by multiplying.
The simulator models biomagnification specifically. At each step, the contaminant concentration is multiplied by the Biomagnification Factor (BMF) — a number that represents how much more concentrated the chemical becomes at each trophic step. A BMF of 10 means the concentration is 10× higher in the predator than in what it ate.
Each level is 10× higher than the level below it. The apex predator ends up with 100,000× the water concentration — from a starting level that sounds essentially harmless.
WHY DOES THE TOP OF THE CHAIN GET IT SO MUCH WORSE?
Because the BMF is applied exponentially, not linearly. Going from TL1 to TL2 adds one multiplication. Going from TL1 to TL5 adds five multiplications, all stacked on top of each other. Small changes in BMF produce enormous changes at the apex — a BMF of 20 at TL5 gives 20^5 = 3,200,000× the water concentration. That is not a typo.
SECTION 4: THE FOUR CONTAMINANTS
The simulator lets you model four real contaminants that are currently present in marine food chains worldwide. Each has its own BMF value, reflecting how aggressively it concentrates in fatty tissue, and its own history in the environment. Click any card to expand it and learn more.
FDA ADVISORY LIMIT: 2,000 PPB FOR PCBS IN FISH TISSUE
The U.S. Food and Drug Administration recommends that fish tissue contain no more than 2,000 ppb PCBs before it is considered unsafe to eat. The Industrial Discharge scenario in the simulator will show you what happens to apex predator tissue when starting water concentrations reflect real-world polluted coastal areas. The numbers are not hypothetical.
SECTION 5: HUMANS AT THE TOP
The simulator labels TL5 "Apex Predator / Human" — and that slash is doing a lot of work. When people eat large predatory fish (swordfish, shark, king mackerel, albacore tuna, striped bass from polluted waters), they are acting as apex predators in the marine food chain. The contaminants that have concentrated through every trophic level below are now arriving in one meal, in one body.
This is why public health agencies issue fish consumption advisories specifically for large, long-lived predatory fish — not because the fish themselves are inherently dangerous, but because they sit at the top of a concentration process that has been running for the entire fish's lifetime. A 20-year-old swordfish has been accumulating PCBs and mercury for 20 years. A three-month-old sardine has not.
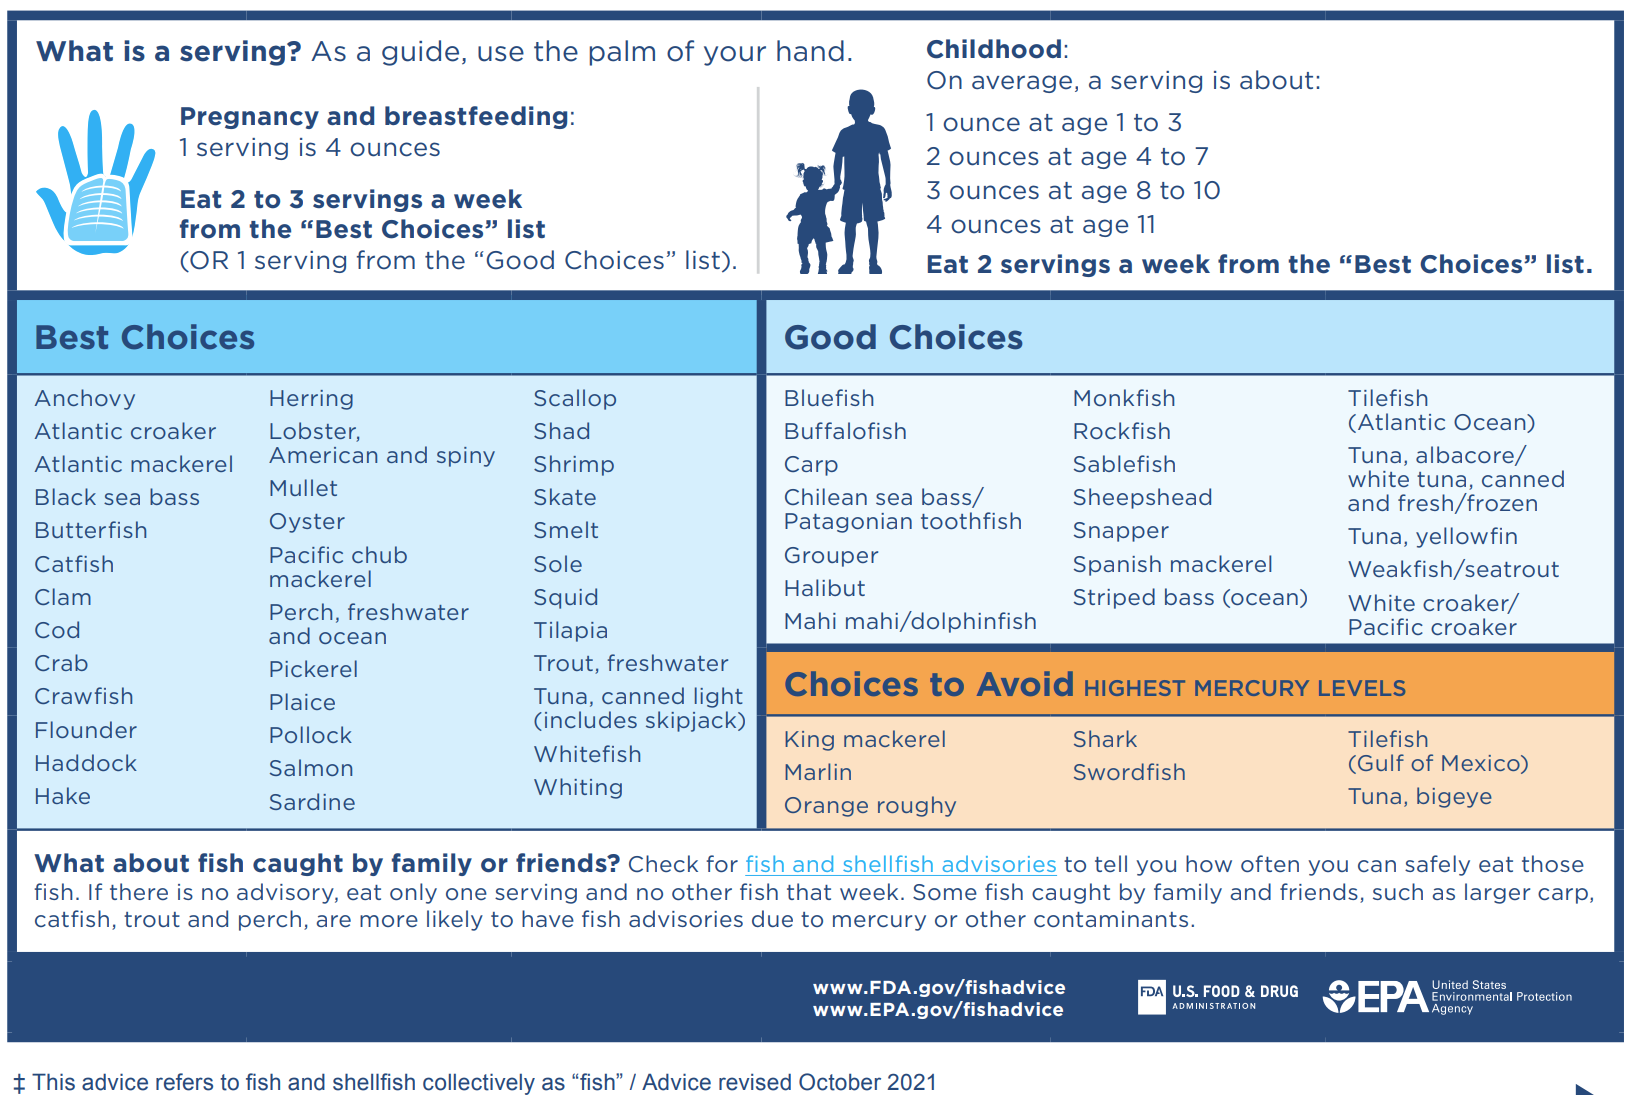
EXTRA VULNERABILITY: PREGNANT WOMEN AND YOUNG CHILDREN
Mercury and PCBs are neurotoxic — they damage the developing nervous system. A fetus or infant receiving these chemicals during brain development faces a much higher risk of neurological harm than an adult exposed to the same dose. This is why fish advisories are especially strict for pregnant women, nursing mothers, and young children. The contamination is not evenly distributed across all risk groups.